
Authored by Erik Lytikainen via RealInvestmentAdvice.com,
Mark Twain once said, “history doesn’t repeat itself, but it often rhymes.” Since President Nixon removed the gold standard in the early 1970s, gold has seen several significant rallies, all of which have similar wave characteristics. Gold rallies seem to rhyme.
The first two price rallies began in 1971 and 1977, during and after the de-linking of the U.S. dollar from gold. The most recent price rally has its seeds in the dot-com bubble in the early 2000s. The chart below shows two long-term monthly gold rallies, with the second rally appearing to be an amplified but similar version of the first. I have overlaid Fibonacci sequence numbers to demonstrate how the price of gold has spiked upward in expanding, fractal waves during these prior surges.
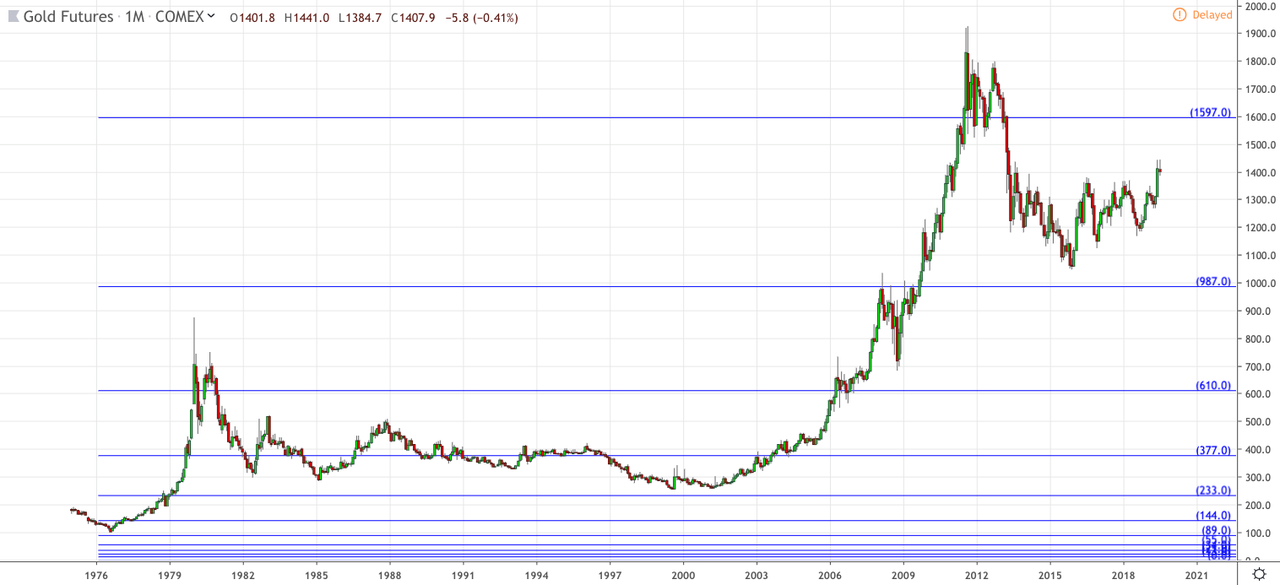
In the 1970s, gold traveled through four Fibonacci levels (by this measure) in less than a decade after the removal of the gold standard. From 2000 through 2012, amid the dot-com and housing bubbles, gold also traveled through four Fibonacci levels on the way to $1,900.
If history rhymes again, and I believe it will, then the price of gold will again spike upward through three or four Fibonacci extensions to the upside, but then re-trace 50% to 70% of that upward move. If so, then the next upward spike could peak in the range between $7,000 and $11,000 per ounce.
Investors tend to make rash decisions based on fear and greed. These emotions are typically amplified during times of financial stress. It is during such times that gold solicits fear and greed motivated buyers. During a crisis, fear investors will rotate into gold to hold value, and greed investors see the upward momentum and jump on the train. The upward momentum of the next gold rally might feel like the Bitcoin surge in 2017.
“Striking Out” in the 1980s
In baseball, its “three strikes and you’re out.” After the 1970’s surge and blow-off top in 1980, gold failed three key technical tests. After these failures, the gold market floundered for another decade. Let’s take a closer look at those three technical failures.
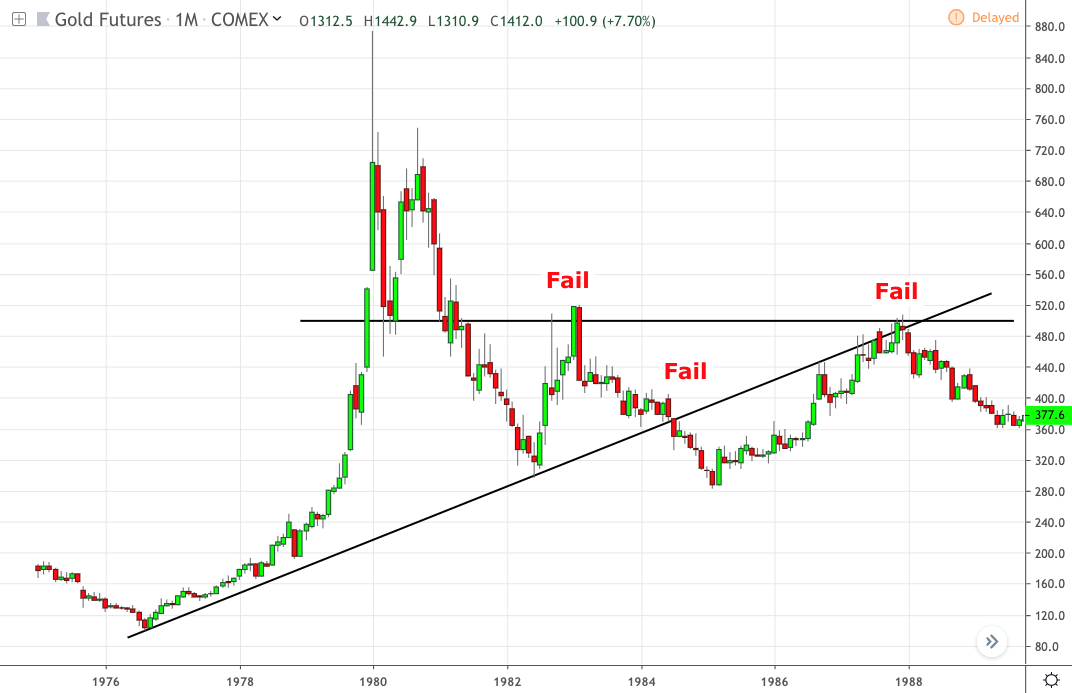
First, in early 1983, gold failed to retake and hold the psychologically important $500/oz price level. This rejection resulted in sideways to lower movement for another year before gold failed again, breaking below its upward trend line near $360/oz. After falling to a low in early 1985, gold moved higher over the next three years, only to fail a third key resistance test near $500/oz in late 1987. After “striking out” in the 1980s, gold fell throughout the next decade back to $250/oz.
Current Technical Structure Is Bullish
Unlike the gold bear market of the 1980s, gold has been passing periodic tests of support and resistance since its sharp decline in 2013. Gold’s price retracement from a high above $1,900 to a low near $1,040 kept the price...