
Authored by Mike Shedlock via MishTalk,
Gold futures just touched $1928 taking out the Intraday high of $1923.70 in 2011.
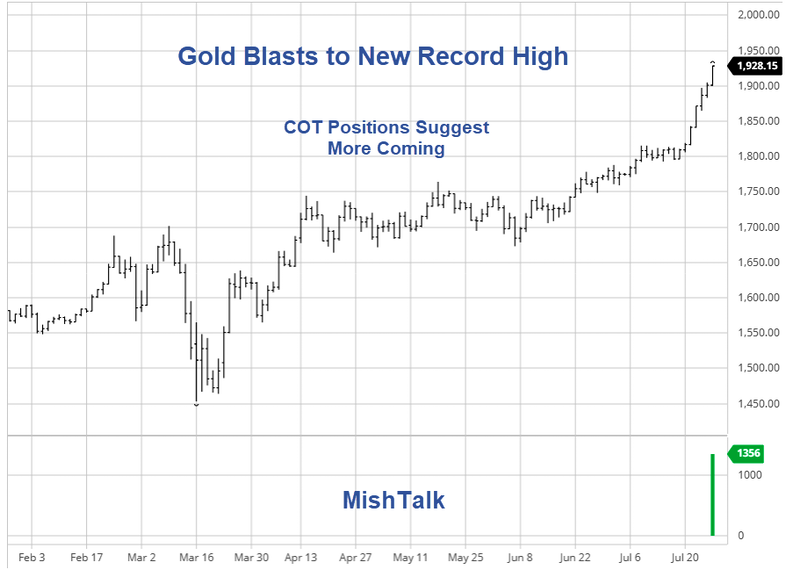
11-Week Run
Gold is on a huge 11-week run. The last time gold did that was at the 2011 high.
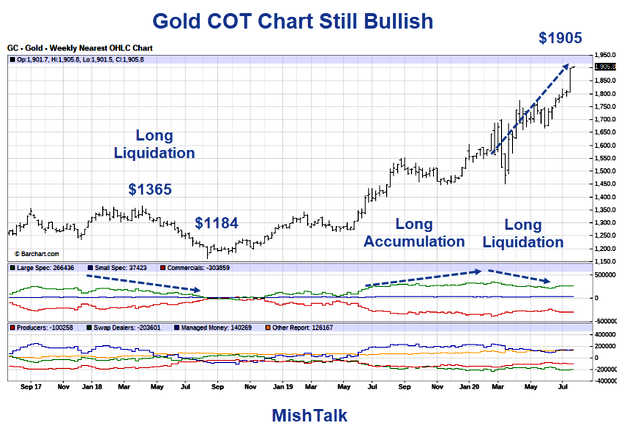
Is a pullback in order? A Gold COT chart says otherwise.
Gold COT Chart
Understanding Futures
In the futures world there is a short for every long.
The first horizontal box has Large Specs, Small Specs, and Commercials. This is It's Old COT reporting.
The second box distinguishes producers from the swap dealers (i.e. market makers). This is New COT reporting.
Those are the actual data links for the above chart.
Large Specs, Small Specs, Unreportable Positions
Large specs are generally hedge funds that trade futures in size. Small Specs are typically individual traders.
Sometimes small specs are called unreportable positions. If you are big enough you have to tell the CTFC what your position is.
Producers
The producers mine gold and sell it via futures. They are always short.
Swap Dealers
The Swap Dealers are commercial market makers who take the other side of the trade. They do so because as Market Makers they have to. It's their business to make a trade.
The swap dealers are hedged. They do not much care if prices rise of fall. If that was not the case, they would be blown out of the water on big, sustained rallies. That does not imply honesty as the dealers have been caught manipulating. Rather, they manipulate if their hedges get out of balance or...